Categories
Background

The link between reading proficiency and poverty

From “Breaking the Link”: systemwide reading results from year 2016-2017, percentage of children in grades 3-5 and 6-8 who are reading proficiently (the minimum for being on-grade-level) and CCR (college- and career-ready), with schools categorized in three roughly equivalent-sized groups: low poverty (0%-24%; 57 schools); moderate poverty (25-50%; 57 schools; high poverty (51%+; 56 schools).

April 11, 2018

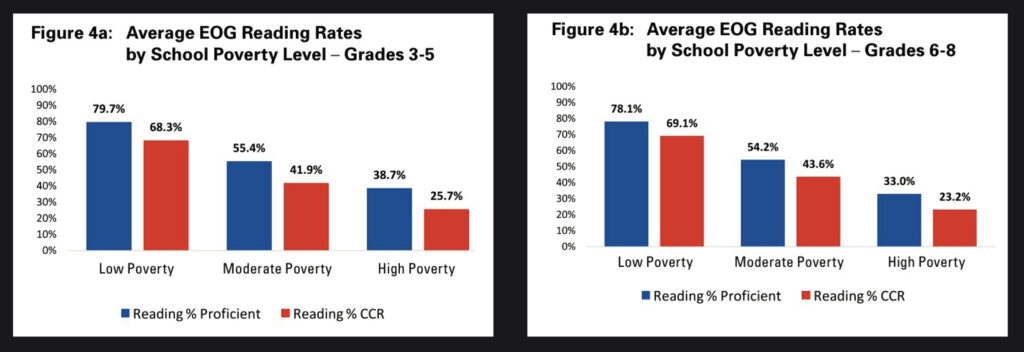
CMS Supt. Clayton Wilcox directed his staff to prepare a report analyzing all the data available on how school achievement and poverty are intertwined. The community has been tracking this link for decades, but the gaps remain. The issue took on some additional urgency when a 2013 Harvard study ranked the city 50th among 50 big cities studied on the issue of economic mobility. More on the CMS effort is on their website.

CMS prepared data reports in 2018 and 2019. They are available in both English and Spanish.

2018 English 2018 Spanish

2019 English 2019 Spanish

(In July 2019, Wilcox left CMS and by August 2019 had been permanently replaced by Earnest Winston. As of Feb. 16, 2020 no new “Breaking the Link” studies had been released.)

Categories
Background

Charlotte annexation through 1988

Source: “Charlotte: Patterns & Trends of a Dynamic City.” Charlotte : Dept. of Geography and Earth Sciences and the Urban Institute at the University of North Carolina, [1992], James W. Clay and Alfred W. Stuart, eds.

Posted March 16, 2013

Categories
Background

Median household income, 1985, in thousands of dollars

Source: “Charlotte: Patterns & Trends of a Dynamic City.” Charlotte : Dept. of Geography and Earth Sciences and the Urban Institute at the University of North Carolina, [1992], James W. Clay and Alfred W. Stuart, eds.

Posted March 16, 2013

Categories
Background

Population, percent black, 1980

Source: “Charlotte: Patterns & Trends of a Dynamic City.” Charlotte : Dept. of Geography and Earth Sciences and the Urban Institute at the University of North Carolina, [1992], James W. Clay and Alfred W. Stuart, eds.

Posted March 16, 2013

Categories
Background

Reach of sewer and water utilities, 1978

Source: “Atlas of Charlotte-Mecklenburg.” James W. Clay, ed.
Charlotte: University of North Carolina at Charlotte, 1981

Posted March 16, 2013

Categories
Background

Percent population change, by census tract, 1970-1976

Source: “Atlas of Charlotte-Mecklenburg.” James W. Clay, ed.
Charlotte: University of North Carolina at Charlotte, 1981.

Posted March 16, 2013

Categories
Background

Truck delivery times, 1986

– Source: “Charlotte: an analytical atlas of patterns & trends.” James W. Clay and Alfred W. Stuart, eds. Charlotte : Dept. of Geography and Earth Sciences and the Urban Institute at the University of North Carolina, 1992.

Posted March 16, 2013

Categories
Background

Reach of sewer and water utilities, 1991

Source: “Charlotte: an analytical atlas of patterns & trends.” James W. Clay and Alfred W. Stuart, eds. Charlotte : Dept. of Geography and Earth Sciences and the Urban Institute at the University of North Carolina, 1992.

Posted March 16, 2013

Categories
Background

CMS attendance plan, elementaries, 1992-93

Source: “Charlotte: an analytical atlas of patterns & trends.” James W. Clay and Alfred W. Stuart, eds. Charlotte : Dept. of Geography and Earth Sciences and the Urban Institute at the University of North Carolina, 1992.

Posted March 16, 2013

Categories
Background

Paths of early American migration

Source: “Metrolina Atlas.” James W. Clay & Douglas M. Orr Jr., eds., Jefferson L. Simpson, cartographer. University of North Carolina Press,1972

Posted March 16, 2013